






1. Purpose and distribution of the report
The Test Report must not be just a static listing of error logs. It is a document that translates raw test data into a business and project context, which is crucial, for example, when compiling regular outputs for NeL Operational Monitoring.
- Responsibility: Test Manager / QA Lead.
- Input data: Results of automated CI/CD pipelines, manual executions, and performance metrics.
- Target audience (Distribution Sheet): Project Managers, Product Owners, and Technical Leaders (Development, DevOps, Architecture).
2. Standardized structure of the Test Report
Each official Test Report must strictly follow the following hierarchy of chapters:
A. Document Header and Metadata
Basic identification of the test cycle for traceability and auditing purposes.
- Project name: (e.g. Operational Monitoring – Release 2.4)
- Tested Software Version (Build ID): Exact identification of the deployed version and environment (e.g. Staging-Env-v2.4.0-rc1).
- Execution date and time: The time frame in which the tests took place.
B. Executive Summary
The most important part for non-technical management. It must contain clear recommendations without complex IT jargon.
- Quality status: Recommended for deployment (GO) / Conditional GO / Rejected (NO-GO).
- Brief review: A short paragraph summarizing the status of testing.
- Example: "All critical E2E scenarios were successful. Performance tests met SLAs. We register 3 minor defects in the UI that do not block the main business flow. The version is ready for deployment."
C. Analysis of test results and Visualization (Graphs)
Hard data aggregated from testing tools. To ensure absolute data reliability, charts are not created manually in Excel, but are inserted as exports directly from central analytical tools (e.g. Grafana).
Mandatory visualizations in the report:
- Test Execution Status (Pie Chart / Donut Chart): Displays the total ratio of tests: Passed, Failed, Blocked, Skipped.
- Analytics view: A high percentage of Skipped or Blocked immediately indicates the instability of the test environment.
- Defect Density & Severity (Bar Chart): Distribution of found errors according to their severity (Blocker, Critical, Major, Minor).
- Analytical View: Defines the fundamental health of the supply.
- Defect Burn-down / Trend Chart (Line Chart): The evolution of the number of open vs. resolved errors over time.
- Analytical view: The curve must converge to zero before the end of the release.
D. List of defects and strategies for their resolution (Defect Log)
Filter the most important mistakes. It shows the added value of the QA team and defines the "technological debt" with which we eventually launch the system into production.
1. Resolved Blockers
A record of catastrophic errors that testing revealed and that were successfully corrected before deployment.
- Example of writing: BUG-892 The database crashed into deadlock when 500 users were writing in parallel. Solution: Modify the index architecture and override the connection pool logic. Repair fully validated by stress test.
2. Known Issues & Workarounds
List of open bugs (Minor/Major) that we have consciously accepted for this release. It is a critical basis for the Customer Support Department.
| Defect ID | Bug Description | Business Impact | Support Workaround | Target Fix |
|---|---|---|---|---|
| BUG-904 | The system times out when generating a report covering more than 5 years. | Low. Typical users generate reports for a maximum of one year. Affects fewer than 1% of cases. | Users should generate the report in smaller time ranges (e.g., 2 years at a time) and merge the data locally. | Scheduled for the next minor release (v2.4.1). |
| BUG-905 | On Apple devices (Safari), the CSS grid layout breaks in the date picker. | Medium. Approximately 15% of users use Safari. The issue affects only the UI and does not impact functionality. | Support has been instructed to communicate that this is a visual issue and recommend using Google Chrome as a workaround. | The Frontend team is working on a fix with High priority for the next hotfix release. |
E. Identified risks and bottlenecks (Risk Analysis)
Translating technical limits and errors into the language of project risks.
- Example notation: "During performance testing, we encountered an IOPS limit on the database. There is a real risk of slowing down the response during production peaks above the expected standard. We recommend that you enable exceptional monitoring at the database tier for the first 48 hours after deployment."
F. Action Plan
Specific tasks for the downstream stages of development, QA and infrastructure.
- Infrastructure: Performing a teardown of temporary Docker containers and K8s namespaces to free up compute capacity.
- Test extension: Implementation of a new E2E scenario in the Playwright repository to cover the
BUG-912regression bug so that it does not happen again in the future.
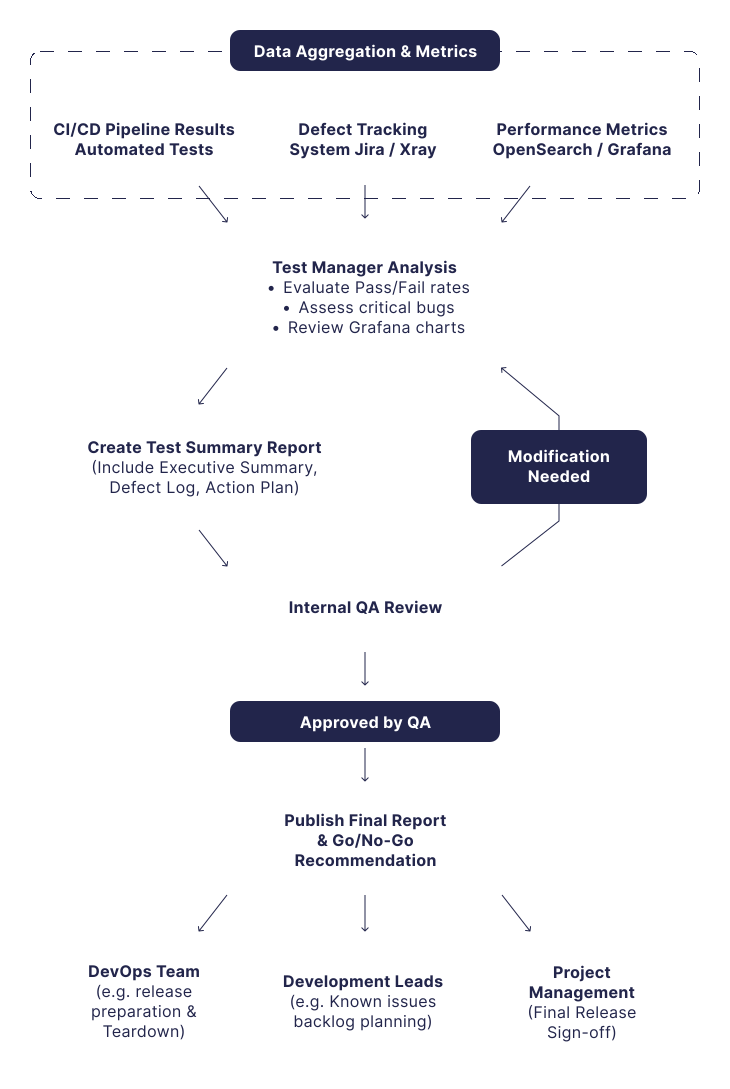
3. Process diagram: Creating and approving a Test Report
The following diagram visualizes the document creation lifecycle from system data aggregation to final project decision.