







1. Strategies and types of performance tests
The design of the load profile shall correspond to the required scenario and test objectives. Targeted operation simulation is performed to measure specific system characteristics.
- Load Testing: Simulates the standard and expected operating state. It verifies the smoothness of the response, throughput and stability of the system at nominal load (e.g. the normal daily operating peak of active users).
- Stress Testing: Stress testing beyond the nominal capacity. It is used to identify the breaking point and monitor the behavior of the system under extreme load. The goal is to verify whether the system degrades in a controlled manner (graceful degradation) without losing data integrity.
- Spike Testing: Simulates a spike in requests from minimum to maximum in seconds. It is used to verify the stability of the system in the event of sudden events (e.g. marketing campaigns, mass notifications).
- Endurance / Soak Testing: Applies a constant load over an extended period of time (usually 24-72 hours). The measurement is focused on performance stability over time, system resource release, and memory leaks detection.
2. Metrics Definition and Test Case Template
Performance execution must be measurable against precisely defined acceptance criteria (Pass/Fail Criteria) based on the Service Level Agreement (SLA).
| Profilspezifikation und Metriken | Profile and metrics specification |
|---|---|
| Test identification | PERF-API-XXX (e.g., load testing of an entity creation API endpoint). |
| Load Profile | Target number of Virtual Users (VUs) or Requests Per Second (RPS). Definition of phases: Linearer Anstieg der Last von 0 auf 500 Virtual Users (VUs) innerhalb von 120 Sekunden., Aufrechterhaltung einer konstanten Last von 500 VUs über einen Zeitraum von 15 Minuten., Linearer Abbau der Last von 500 auf 0 VUs innerhalb von 60 Sekunden.. |
| Data prerequisites | Preparation of synthetic test data. For performance reasons, no manual or synchronous data creation may occur during the load; a pre-generated data pool in the database is required. |
| Metric 1: Response time (Latency) | The 95th percentile response time (P95 Latency) must not exceed the defined limit (e.g. < 500 ms). |
| Der Anteil fehlgeschlagener Anfragen muss < 1 % betragen. Vereinzelte Fehler aufgrund von Rate Limiting sind zulässig; flächendeckende Verbindungsfehler sind nicht akzeptabel. | The percentage of failed requests must be < 1%. Occasional errors caused by rate limiting are expected; widespread connection failures are unacceptable. |
| Metric 3: System resources | CPU utilization and RAM allocation on application and database nodes must not exceed 80% over a sustained period. |
3. Test scenario parameters
Subject: Validation of backend endpoint capacity (/api/v1/it-visit) for processing parallel database write requests.
| Execution parameter | Action |
|---|---|
| Test objective | Achieve and sustain a load of 500 RPS without database layer failures or deadlocks. |
| Linearer Anstieg der Last von 0 auf 500 Virtual Users (VUs) innerhalb von 120 Sekunden. | Linear load increase from 0 to 500 VUs within a 120-second window. |
| Aufrechterhaltung einer konstanten Last von 500 VUs über einen Zeitraum von 15 Minuten. | Maintain a constant load of 500 VUs for 15 minutes. |
| Linearer Abbau der Last von 500 auf 0 VUs innerhalb von 60 Sekunden. | Linear load decrease from 500 to 0 VUs within a 60-second window. |
| Acceptance criteria | • Max P95 Latency < 800 ms. • Zero data corruption; successfully completed transactional writes. |
4. Execution Architecture and Monitoring
Due to the hardware demands, performance tests are not integrated into the standard CI pipeline with each commit. They are configured as Nightly Builds or run on demand in dedicated environments.
Collect metrics and visualize:
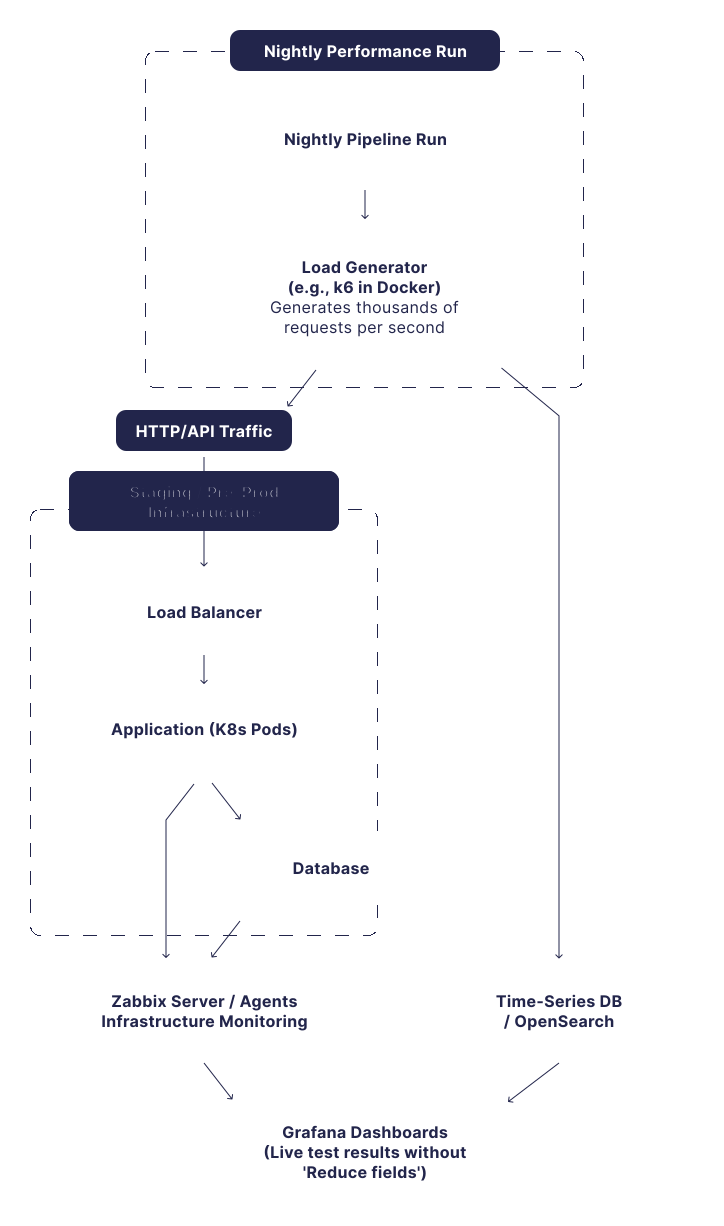
A key aspect is the aggregation and correlation of data from the test generator layer and from the monitored infrastructure layer.
- Load Generator: A containerized tool (e.g., k6, JMeter) that performs distributed load on defined targets. Responsible for sending telemetry about response times and status codes.
- Infrastructure monitoring: Measurement agents (e.g. Zabbix) monitoring computing resource utilization, disk I/O operations, and network throughput on application servers, load balancers, and databases.
- Analytical Dashboarding: Storing aggregated results in Time-Series databases (e.g. OpenSearch, Prometheus) and visualization (Grafana).
- Best practice visualization: When creating analytical panels, it is necessary to aggregate data at the level of database queries. To prevent rendering failures and increase the overall reliability of visualizations, it is prohibited to use complex client UI transformations (e.g., the
Reduce fieldsfunction).
- Best practice visualization: When creating analytical panels, it is necessary to aggregate data at the level of database queries. To prevent rendering failures and increase the overall reliability of visualizations, it is prohibited to use complex client UI transformations (e.g., the
Visual diagram of the architecture of the performance tests:
5. Documentation for performance tests (Test Plan)
A Test Plan must be formally drawn up before load testing begins. The document defines the technical prerequisites and limits of execution and unifies expectations across teams (QA, Development, IT Operations).
The preparatory documentation includes:
- Business Objective: Specification of the primary reason for the test (e.g. verification of the scalability of the architecture before deploying a new version, audit of limits before a marketing campaign).
- Test Scope: Define tested and intentionally untested components (e.g., exclude static content distribution via CDN to focus the load on the application runtime).
- Data model: Determination of the volume and logical structure of the database before running (e.g. the need to generate 100,000 user profiles to simulate the real size of the indexes).
- Environment topology: Documenting variations between test and production environments (hardware specifications, cluster configurations). If the test environment has lower computing power, you must specify a method for extrapolating the final results.
6. Final Report (Test Summary Report)
The Test Summary Report serves as a formal audit artifact that evaluates the readiness of the monitored system for operation or deployment. The document is structured to provide immediate analytical value and define clear corrective actions.
Standard report structure:
- A. Executive Summary: Final evaluation of the status (PASS / FAIL / CONDITIONAL PASS). It provides an immediate interpretation of the result without the need for technical analysis (e.g. "The system met the performance criteria up to a load of 500 RPS without degradation. The application meets the conditions of deployment.").
- B. SLA evaluation: Data correlation of measured results against defined parameters. It contains a tabular or graphical summary of key metrics (P95 Latency, Error Rate, throughput).
- C. Bottleneck Analysis detected: Identification of hardware, network, or software limits detected during load (e.g., database IOPS-level limitation while maintaining 40% of the unused capacity of the application CPU).
- D. Action Items: Suggestions for optimization (e.g., implementation of a new database index, modification of connection pool parameters, recommendations for horizontal scaling).